


News
Microsoft Fabric vs Power Bi
Now you might be thinking, huh, Microsoft Fabric vs Power Bi not the same thing? Well, I can assure you they are two different products. And in this article, I'm going to be telling you the scope of each of those products, as well as some of their key features.
- Published
- 8 November 2024
Microsoft Fabric vs Power Bi: What is the difference?
Now you might be thinking, huh, Microsoft Fabric vs Power Bi not the same thing? Well, I can assure you they are two totally different products. And in this article, I’m going to be telling you the scope of each of those products, as well as some of their key features.
Valto are Microsoft Fabric and Power Bi experts. Speak to us today.
An overview of Power Bi
So, let’s start off by talking about Power BI. Now Power BI is probably the more well-known product name as it’s been around for a lot longer.
The core fundamentals of it are that Power Bi allows you to connect a wide variety of data sources. From small excel spreadsheets to much larger cloud-based systems such as SharePoint lists Dataverse, SQL tables and so much more.
It will also allow you to connect to on premise data sources and merge them all together into a report.
Data transformation with Power Bi
The next step, which is data transformation. Power BI allows you to transform and prepare data for analysis using the Power Query editor. With Power Query, you can clean and reshape data, merge it and join data from multiple sources and create calculated columns and measures.
You can transform the data as it’s coming in, to present it better in the next step, which is data visualization.
Visualising data with Power Bi
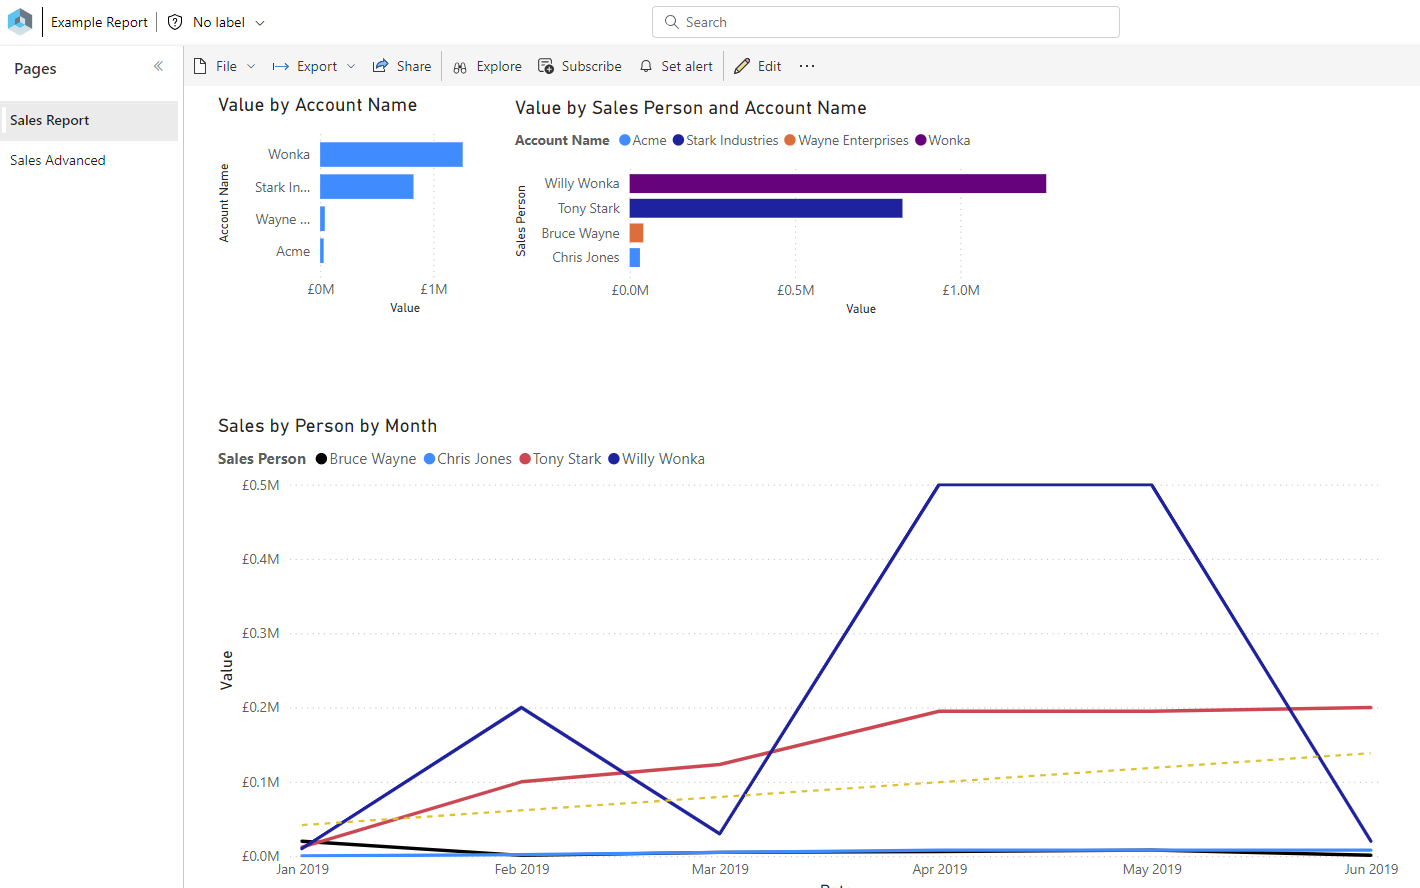
Power bi allows you to create interactive dashboards and reports with drag and drop interfaces. You can create a wide variety of visualizations including bar charts line charts donut charts and maps.
It’s also worth mentioning that Power BI also has some AI powered features.
Power BI uses AI powered insights to help you quickly identify trends, anomalies, and outliers in your data. With quick insights, you can get automated insights with just a few clicks.
Now this is a fantastic way of surfacing up key, valuable insights that you might not have spotted by just looking at a report, um, it will print it out in human, readable text.
Power Bi used for tracking Sales performance
So what are some use cases for power bi? Very commonly, it’s used for sales and marketing analytics power bi is ideal tool for sales marketing analytics.
Allowing users to easily visualize and analyse data related to product sales custom demographics and marketing campaigns. This is probably one of the most commonly used use cases that we see power bi being used for.
Now, although Valto use Power BI for all of our sales and marketing tracking to produce dashboards, I’ve just mocked together here a very quick sample with dummy data to show you what this could
Financial reporting is another use of power BI. Users can use power bi to analyse reports on financial data such as revenue expenses and profit margins.
I know this is especially valuable for companies which are going through periods of growth. perhaps even looking at things like EBITDA and other figures that they have to track from a financial point of view.
Power bi is a fantastic way of bringing in that data from multiple locations and then presenting it back in a nice report.
How supply chain management utilize Power Bi
A final use case of Power Bi would be the use of reporting within supply chain management. Now supply chain management is another area where Power bi can be useful.
Users can use Power Bi to track and analyse key metrics such as inventory levels shipping times and supplier performance.
Recently we supported a customer’s project where it was a construction company who were actually keeping track of their suppliers and how they were performing. They wanted to make sure that suppliers performance remained consistent over long periods of time.
Their program managers were providing data via a Power Apps solution that Valto built that was bringing the data in and storing it within Dataverse.
Then Power BI was pulling that data into a management report. the data was essentially scoring each of these different suppliers every single week. So, then performance could be monitored over a period, over months, potentially even years.
You could see how the performance of those suppliers was changing whether they’re going up or down. If it was going down, we can trigger automatic notifications to follow up with those suppliers and dig further into any potential issues.
If it’s going up, then obviously we want to make sure that we’re keeping that relationship with that supplier going well so we could issue automatic emails thanking the supplier for their continued excellent service.
Key features of Power Bi
What are some of the key features of Power Bi. Over and above just a way of presenting reports back to stakeholders.
Real time data insights
You can also build these dashboards with Power bi to provide interactive dashboards that allow users to track real time data. Create visualisations that can be customized and shared with others.
Now this is really the game changer of why Power bi such a fundamental part of the reporting process of is so many organisations.
It will allow you to refresh the data in live time!
Schedule data refreshes
Not all data suitable for live viewing. It can take time to collect and even cleanse before it is presented back. So perhaps you do not want to show all the live data and instead schedule when you want the data to be imported into the report.
it might be that you do it once every few hours, once a day, once a week, whatever is a kind of time frame that suits you.
Integrate data with natural language questions
Reports are presented often with specific questions in mind to answer. But as we know, new questions often arise over time and you want to be able to get answers to those questions quickly, without relying on a Data Analyst or developer to update your report.
This is where querying with natural language questions steps in.
“How many new suppliers have we onboarded this quarter” is an example of a natural language question.
Power Bi allows users to ask questions in natural language and get answers in the form of visualizations and insights without the need for complex coding or programming.
you could type in a question to say, Um, who had the best performance score out of all of our suppliers.
AI Powered insights with Power Bi
Now I know what you are thinking “But what about AI?” well of course, just like everything else these days Power Bi has AI insights built into it to further help you analyse the data you are presented with.
AI powered insights to automatically identify trends and patterns and data and provide recommendations.
You might not even necessarily be looking for certain trends yourself, but AI can then look at something and present it back to you in human readable language to say, did you know that this supplier’s performance has been down every single week for the past three months?
Those are the types of AI powered insights that you might not be looking for, but it could surface to you.
An overview of Microsoft Fabric
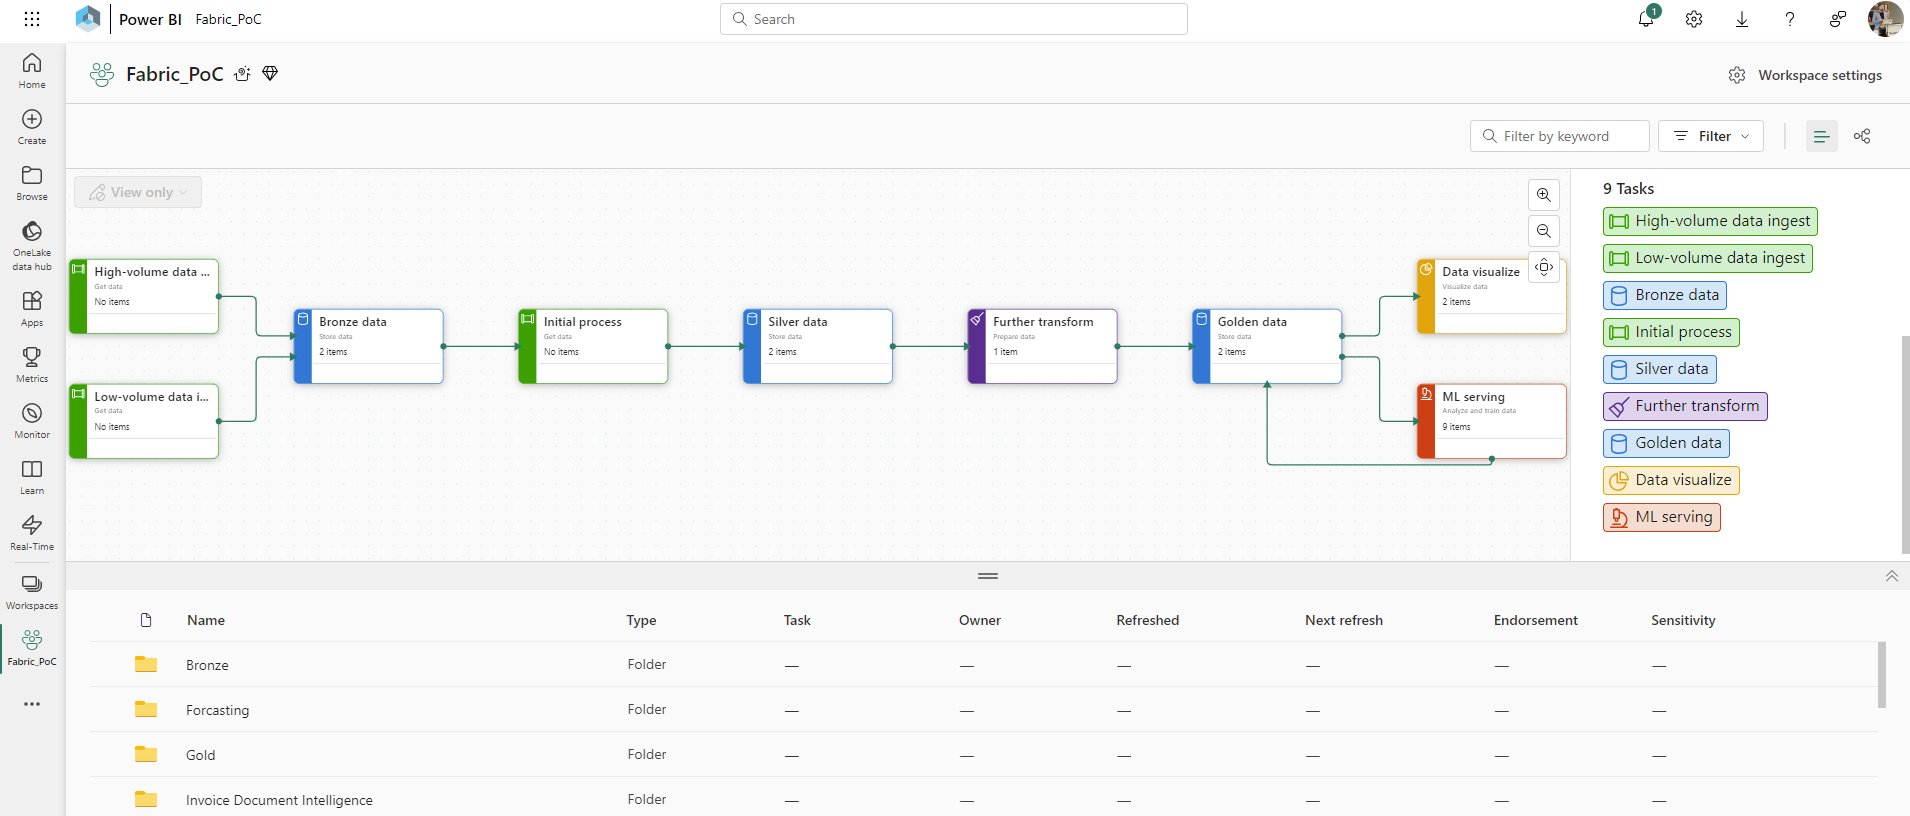
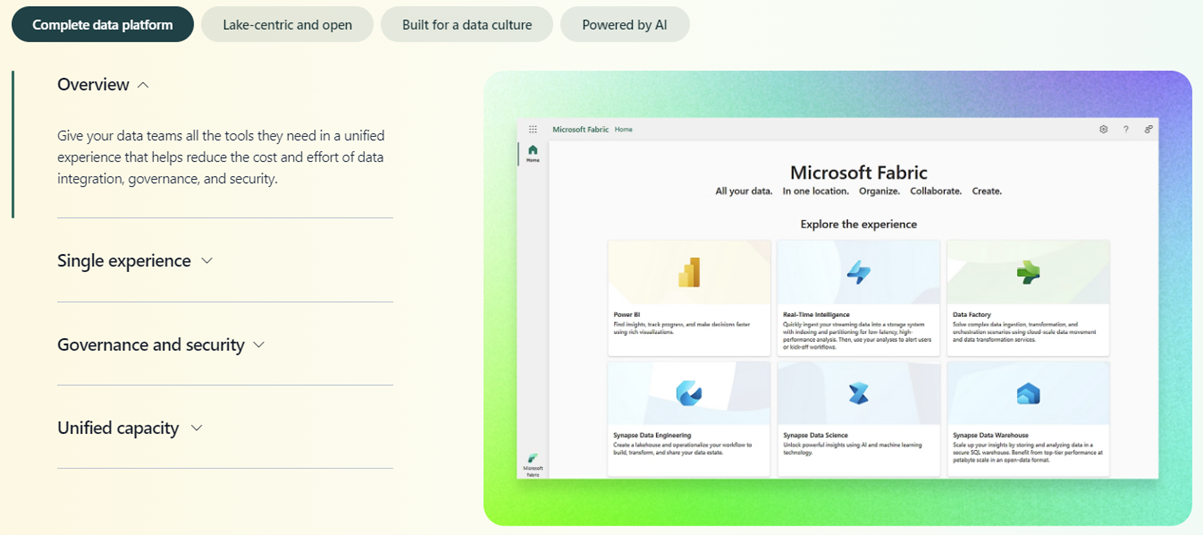
So, what is Microsoft Fabric? Now, Fabric is a platform designed to help you build and manage applications that are scalable, reliable, and easy to deploy. It provides a runtime environment specifically for microservices based applications. Not only that, but Microsoft Fabric also takes care of managing the lifecycle of services running in the cluster. This includes tasks like deployment, scaling, and failover, ensuring that your microservices based applications are always available and performing optimally. The official Microsoft website for Microsoft Fabric has some good visuals on here which show Fabric now fabric is not just one product. In fact Power bi actually sits at the front end of Microsoft fabric in terms of that's what's providing the kind of visualization elements of it. But there's multiple other products which sit underneath Fabric. So think of Microsoft Fabric like a suite of products. Kind of like how we have the office suite of like Word, PowerPoint and Excel. Microsoft give a fantastic overview of Fabric as the ability to give the data teams, all the tools I need in a unified experience that helps reduce the cost and effort of data integration, governance, and security. Now, this is fundamental because actually what we're doing here is we're taking the need for some of these kind of much larger data teams to manage data projects and putting the power into much smaller teams. Microsoft Fabric is a Saas (software as a service) a cloud hosted product, so we're not actually needing as much time and money invested into the maintenance of a data platform.
Microsoft Fabric is everything under one roof
Microsoft Fabric is described as a single experience, so it helps data engineers, data scientists analysts and business users achieve shared goals with software As a service that is truly built for collaboration.
The governance and security allow us to gain end to end visibility of our data, Usage and adoption insights and industry leading governance and compliance capabilities.
We have the unified capacity to simplify billing and help reduce costs with a single pool of capacity and storage that can be used for every workload.
This means that we can truly scale what we’re doing with our solutions.
We have a lake centric, um, and open, um, Type of approach, which means that we can simplify data integration from nearly any source into a single multi cloud data lake for your entire organization and work from the same copy of data across an analytics engine, uh, analytics engines and languages.
Lake centric focus with Microsoft Fabric
This means you can put all of your data into one place. So, you’re not having to mop up loads of different data locations, no data movement. Which means that we can create shortcuts between data items across clouds like Azure and AWS without duplication, movement or ownership change. As well as that we have one copy across all engines.
Reduce data duplication by using single copy of data to power all of your workloads.
One Lake data hub brings your data together within an intuitive hub that’s automatically indexed for discovery sharing, governance and compliance. This is why we refer to Microsoft Fabric being a lake centric focus.
This lake centric focus is empowering everyone to uncover insights with relevant data, easy to use tools and stunning visuals and allowing it to be embedded into Microsoft 365 apps that you use every day.
Direct lake mode saves time for analysts and provide up to date insights with fast real time connection to your data in one lake.
Built into microsoft 365 you can foster data driven culture by seamlessly and securely following insights into microsoft 365 apps Including teams excel powerpoint and outlook and finally data drift data driven actions easily set up end to end solutions to teams Can act quickly in response to time sensitive events.
AI in Microsoft Fabric
As I mentioned earlier, everything’s got a flavour of AI in it, but nothing is probably as valuable as the AI which is available inside of Microsoft Fabric.
It allows us to adapt a data platform that’s infused with AI at every layer to help you get more done faster. We can create impactful reports faster.
You can simply describe what you need, including reports, summaries, and calculations, or ask a question, and Copilot will do the rest.
Do more with Copilot for Microsoft Fabric, use conversational language to create data flows and pipelines. It will allow you to write SQL statements or even build machine learning models.
Now this really is a game changer because if you’re quite new to Microsoft Fabric, then copilot can really help fast track what you need to know. It will help you learn and reach your goal much quicker than if you did not have a Copilot sat alongside you.
Microsoft Fabric vs Power Bi use cases
So just a few use cases that we’ve seen for Microsoft Fabric.
How Microsoft Fabric is being used in E-Commerce
We have e-commerce platforms where Microsoft Fabric is an ideal platform for building and managing e commerce applications that require high level scalability as well as reliability Um, so such as online marketplaces and shopping carts.
We have seen clothing websites and other E-Commerce companies who have loads of data that are stored on both the products and the sales. Millions of rows of data that relates to the entire lifecycle of the products and sales information.
All of that being stored inside of Microsoft Fabric. Then we can use things like the Power BI, which is a product with inside of Fabric to surface that to generate the reports that display key information on sales trends and buying activity.
Microsoft Fabric use for IOT devices
We’ve also used Fabric, IoT, which is Internet of Things applications.
Microsoft Fabric is well suited for building and managing IoT applications that require real time data processing and analysis, such as smart home systems and industrial automation.
We have worked with manufacturing companies that have used IoT devices on machinery for checking things like temperature and weight.
All of this information generates an eye watering amount of data that needs to be stored and monitored. All of which is then piped back into a live system.
Differences when comparing Microsoft Fabric vs Power Bi
But what about the differences between Fabric and Power BI?
So, at a high-level Fabric is focused on building and managing microservices based applications, providing a highly scalable and reliable platform for building and deploying services.
Whereas Power BI is focused on data analytics and visualization, providing a user friendly interface for data analysts and visualization.
So, although the data is stored within the products of Fabric, such as OneLake, and maybe using some of the other products within Fabric for processing you’re surfacing the report still using Power Bi as power is part of that fabric suite.
The purpose as I say Microsoft Fabric provides a comprehensive platform for building and managing data rich applications. its scope includes managing the life cycle of services running in the cluster including deployment scaling and failover. Whereas Power BI provides a set of business analytics tools for analysing data and sharing insights.
Power Bi scope includes connecting to a wide variety of data sources, preparing and transforming the data, and creating rich visualizations using a drag and drop interface.
Free 1 Hour Microsoft Fabric vs Power Bi Consultation
If you need any professional assistance with either power bi or fabric. Then you can contact Valto today for a free one-hour consultation. This is where you get you in touch with one of our experts.
They’ll discuss your data project with you and provide guidance based on thousands of data projects that we’ve previously run.
We’ll help you choose what the best product is for the job and where best might be to store and process your data.
We can then discuss next steps with you. We can provide you a requirement gathering workshop, which is basically where we’ll come into your office or even do it remotely via Microsoft Teams.
Then speak to you about your project, discuss what you want to achieve, and we can help provide guidance throughout that project.
Microsoft Fabric vs Power Bi – Our Expert Says
Power Bi has always been a fundamental piece of data analysis, but Microsoft Fabric is the entire data solution.
How can you ever improve your business making decisions without proper data insights to support those decisions.
With Microsoft Fabric you can store, process, govern and secure all of your data.
Then leverage Power Bi to create interactive reports leveraging AI insights to give you the information you need to make strategic decisions.
Combining Microsoft Power Apps into the solution means you have a Power Platform solution from end to end that captures, stores, analyse and reports on your business process.
Trusted by Leading Brands
“We work with organisations across many sectors of different shapes and sizes from 10 to 100,000 employees.”
Contact Form
Contact our team today!
Talk to our team
Contact Us
Related reading

EventAI & Automation
What’s next? How data, automation & AI are reshaping business
17 November 2026 · 11:00 · 20 Stories, Manchester

NewsAI & Automation
Valto and Holstein UK launch major multi-year digital transformation programme
New partnership will modernise core systems and create a connected, data-driven platform powered by Microsoft technologies.
6 October 2026