


News
Power Bi Examples and Use Cases
From tracking your marketing performance on how well it brings in leads to how well your sales team are closing deals. We will also be looking at Power Bi reports that will support your operations department with resourcing and timesheet management.
Power BI
- Published
- 21 November 2024

Top 5 Power Bi Examples and Use Cases
I’m going to be giving you my top five Power Bi examples and real life use cases that I think every business should be implementing.
From tracking your marketing performance on how well it brings in leads to how well your sales team are closing deals. We will also be looking at Power Bi reports that will support your operations department with resourcing and timesheet management.
Tracking marketing performance with Power Bi Examples
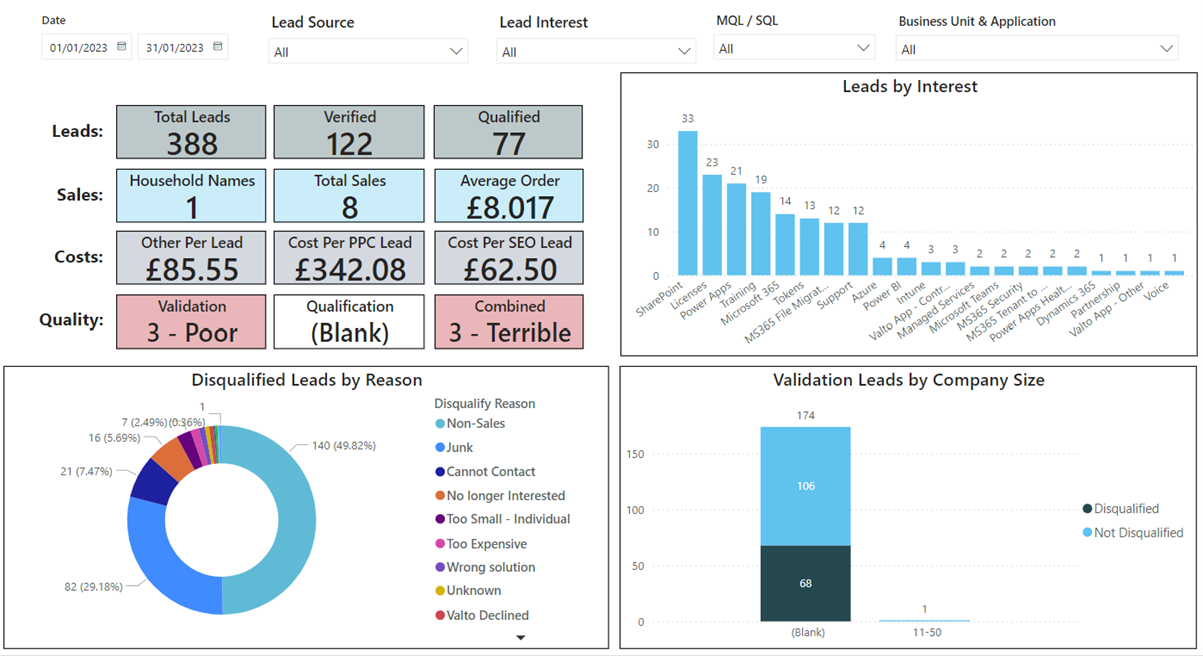
So first off, I want to talk about tracking marketing leads. Now, this applies to every type of organization. In some way, shape or form, you’re going to be doing some kind of marketing, and then you’re going to have inbound leads that you’re wanting to track to see how your marketing is performing.
Now, although this is a real report, this is just some dummy data valve to have implemented internally a full suite of power guy reporting, which helps us track everything from an initial lead all the way through to a sale. And then I’m going to show you some of the other things that we track in terms of our projects later.
But this is just a high level just to show you what you could potentially achieve. Now this is all pulling from our CRM system.
Essentially what we’re doing is breaking this down into a few areas. We can see the total amount of leads that we’ve seen come in. How many got verified as in they got checked by the marketing team to ensure they were a real lead and how many were qualified by sales team.
Power Bi Examples of Sales managers reporting
Now the next logical step that if you’re tracking your marketing efforts to understand what leads are coming through. You should also understand what sales are being processed and actually coming out on the other end of the conveyor belt.
Unfortunately, I didn’t have a draft version of our real Sales report to show you with dummy data in it.
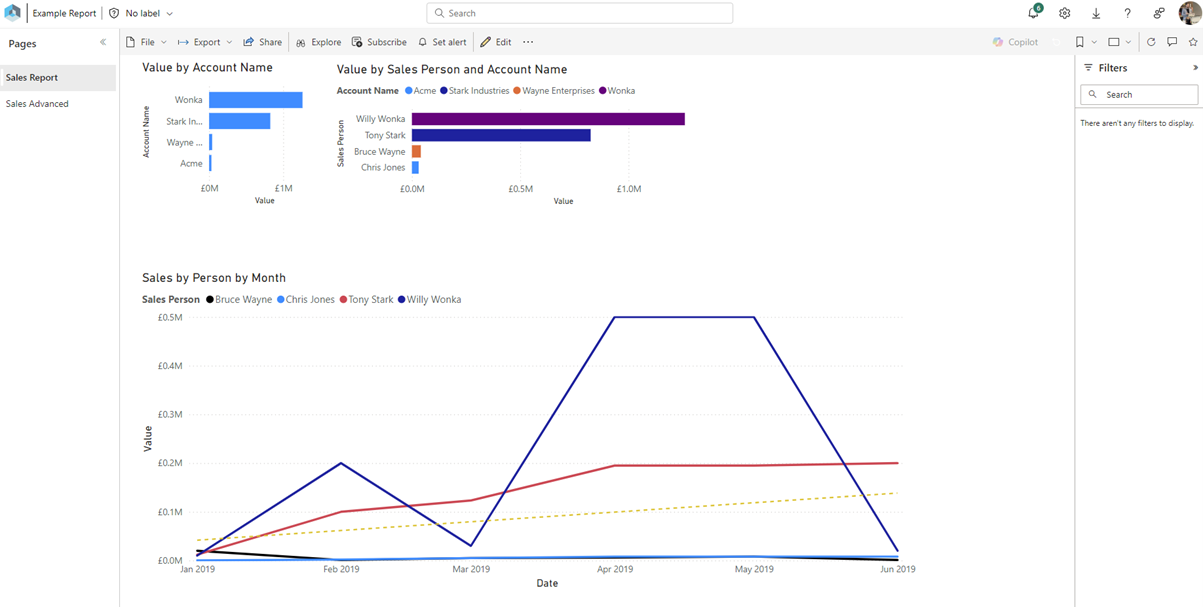
So instead, we’ve mocked up just a fake quick example of what sales report could potentially look like using Power Bi for a sales manager.
It gives you essentially the fundamentals of what you need to know, which is essentially, you want to be able to look at sales that have been made. Their worth and potentially what accounts or what customers they’re coming from.
Now this is really useful because we can then track this to see how sales have been going up and down over a period of time. And you can see her for example, I think it’s the Willy Wonka color. He’s obviously had a good kind of month in April and in May, and it’s dipped off again in June.
It makes it much easier for sales managers to track the sales over a period of time. Obviously, this is very basic and simplistic, and we can make this a lot more advanced for tracking each and every sale.
The cool thing I love about Power Bi though is that we can actually select a particular Salesperson and by selecting them you’ll then see all the other reports will then adjust.
So, you can then see where the sales have actually gone, for example, if I was to select on Bruce Wayne, you could say he actually had a really good month in January and then it’s dipped down and it’s not really recovered since January.
Power Bi Examples of Policy reviews and acceptance
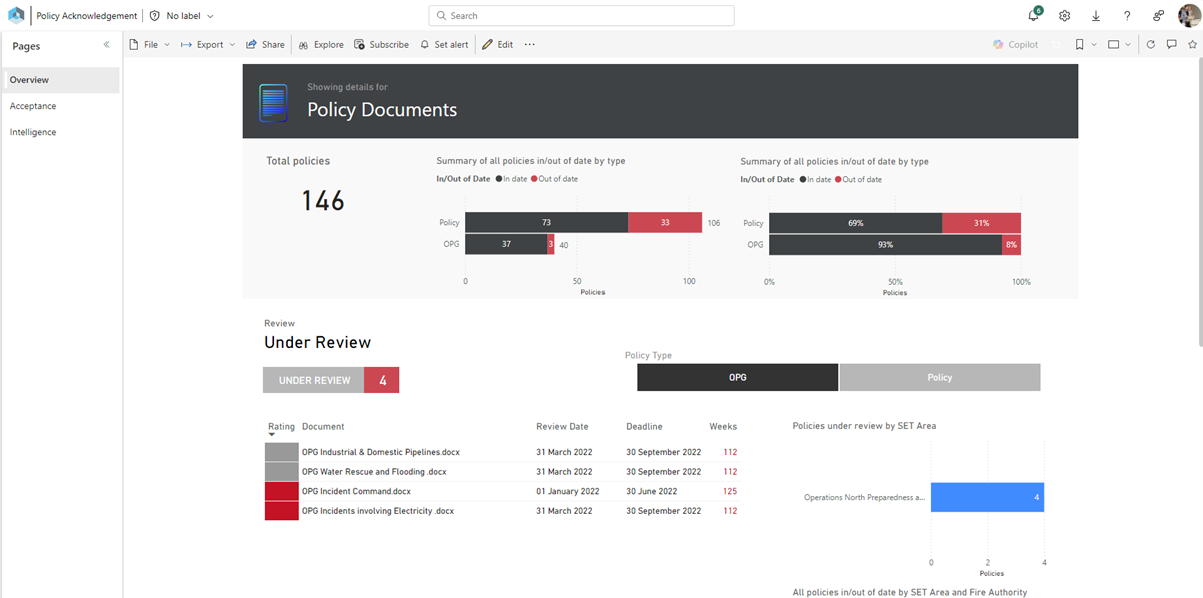
I think this is a vital thing again, that every business should be implementing with Power BI. Not only tracking when policies are coming up for review but also policies acknowledgement. Now this is a little less known use case for Power BI, I should say. But we've implemented it internally here at Valto and found it really successful. Essentially what we're doing is we're using a prebuilt, system that Valto builds called control documents, which is a SharePoint policy management system to capture our policies and then issue them out automatically using power automate to our employees. Then capturing actually who has responded to say that they've accepted that policy so they understand it. Now this gives us two things. One is that we get a good understanding of who's actually accepted those policies and in fact we do track the individual employee names of who's accepted individual policies. So say for example there's ever a data breach or there's something that wasn't quite right, we could pull up the policy that says our stance on data and then, have a meeting with the employee that broke the policy and say, look, you signed and accepted this policy at this date and time. It also is a great way of tracking to make sure that policies stay up to date. So we can build a dashboard. Again, this is just a dummy dashboard just to show you, the types of things which are possible. We can see the total amount of policies. We can see a summary of all the policies that are in and out of date. So any that are out of date, potentially will then flag as red. And then by clicking through to that, we can drill down to see which policies are currently being flagged as out of date. Further down, I can see all the kind of policies which are currently under review. As I scroll further down I can see ones which are upcoming for review, so I can get ahead of the schedule and make sure that i've got time planned in for updating any more policies which are coming through.
Resource tracking and timesheet management with Power Bi
Now the next Power Bi report that I think every organization should have is reporting on time sheets.
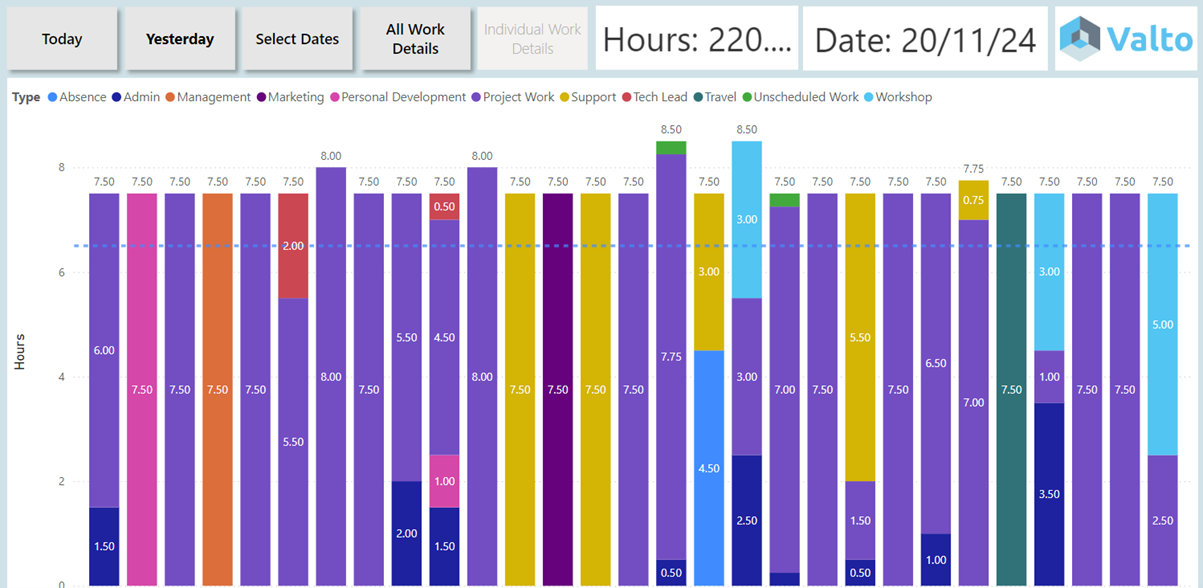
So most organisations will track their workforce with time sheets on a daily or weekly basis. Usually it’s against particular projects or work streams that they’re currently working on.
This allows them to see how the time is being split. This isn’t necessarily something which is about micromanaging and understanding exactly where every last minute is going.
But essentially it’s a good way of making sure that the team is well balanced. So you don’t want people to necessarily be overly worked.
So, say for example, I can see here that an employee has submitted 15 hours. If this was real data, we could look at this and go well actually has he worked 15 hours?
Or maybe it has been a mistake. It looks like he has submitted two days worth of time into one day and we need to go resolve that.
As we’ve logged too many hours against the project that we need to take back off. So we are making sure we’re not overcharging our customers, but also, we’re making sure that we’ve got the right amount of hours left in the project.
Power Bi Examples – Our Expert Says
Using Power BI in our organization has brought about major changes.
It gives us deep insights into our work, helping us make decisions based on data with certainty. Being able to turn complex data into easy-to-understand visuals has helped our teams spot patterns, improve processes, and boost business growth. Power BI is more than just a tool; it’s a key part of our strategy to stay ahead in a tough market.
– Jay Wellings, Head of Business Applications
Trusted by Leading Brands
“We work with organisations across many sectors of different shapes and sizes from 10 to 100,000 employees.”
Contact Form
Contact our team today!
Talk to our team
Book FREE Consultation
Topics
Related reading

EventAI & Automation
What’s next? How data, automation & AI are reshaping business
17 November 2026 · 11:00 · 20 Stories, Manchester

NewsAI & Automation
Valto and Holstein UK launch major multi-year digital transformation programme
New partnership will modernise core systems and create a connected, data-driven platform powered by Microsoft technologies.
6 October 2026